Intelligence that runs
your commissioning
CxStat is the intelligence layer that enables autonomous readiness in real time across your commissioning ecosystem for data centers.
CxStat is the intelligence layer that enables autonomous readiness in real time across your commissioning ecosystem for data centers.
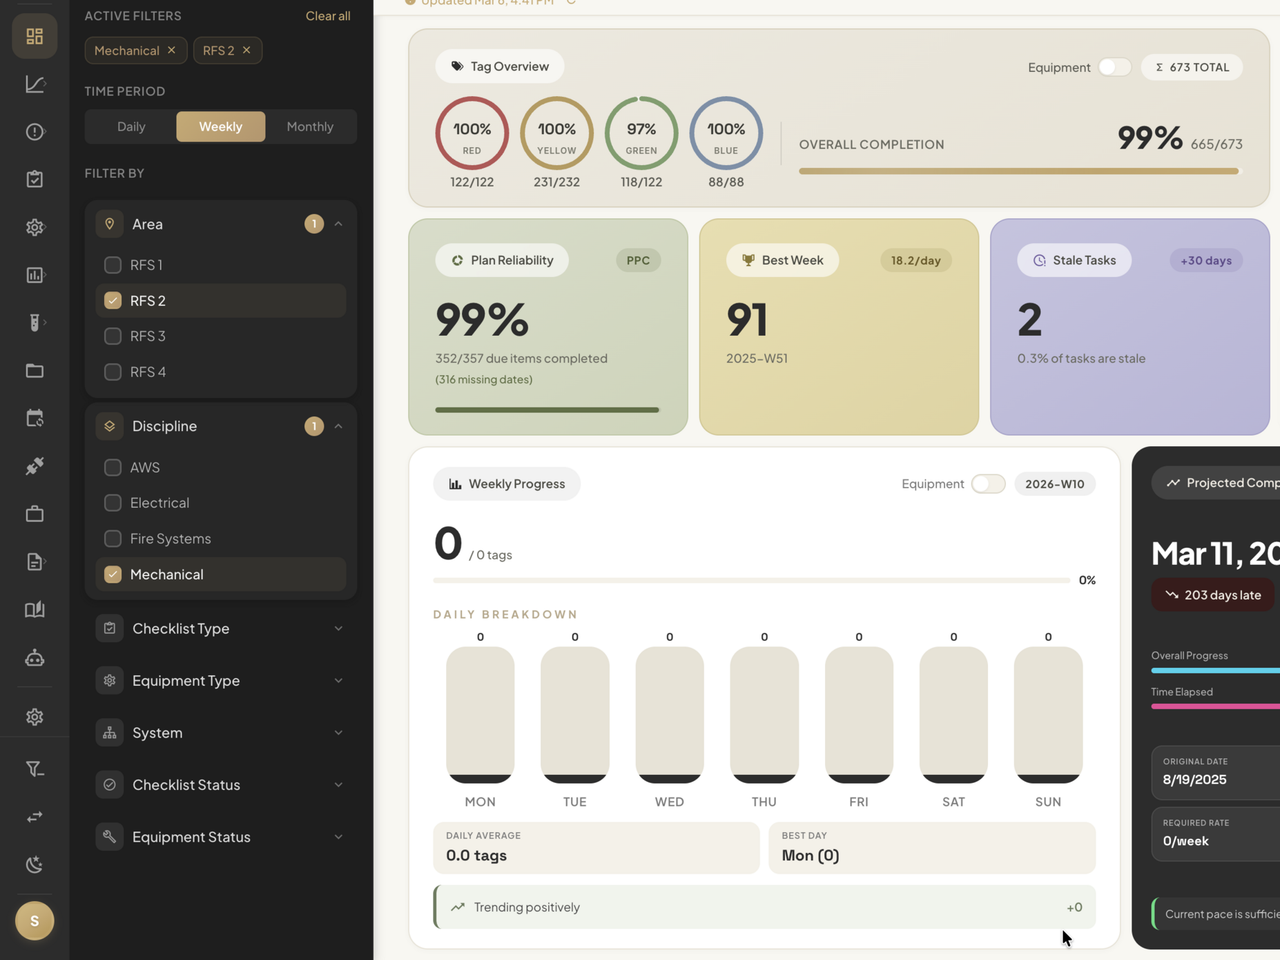
Project Overview
Track portfolio KPIs, compare projects side by side, and keep filters synced across every tab.
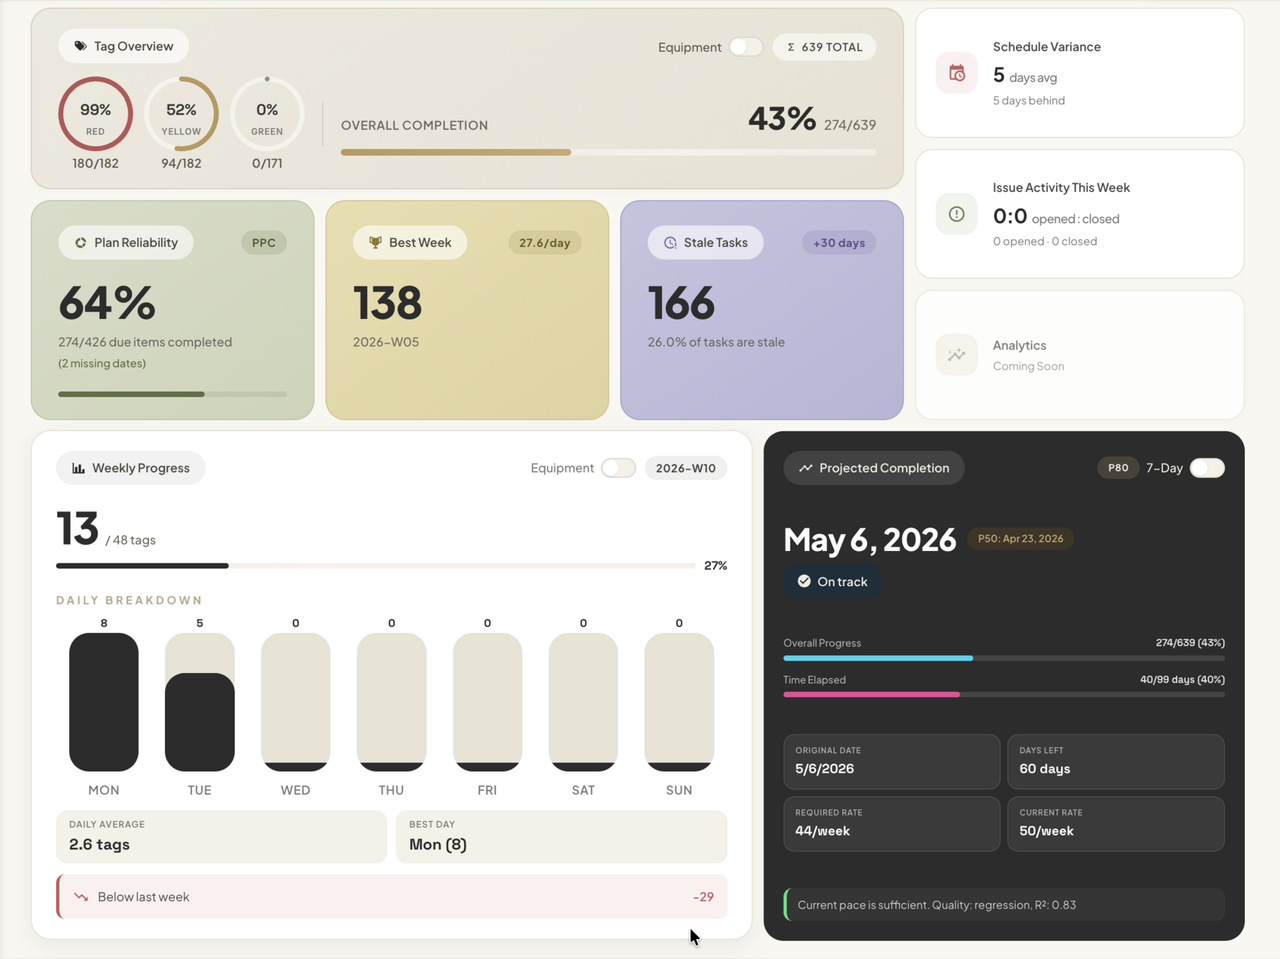
Know project status instantly
See six live KPIs — Plan Reliability, Schedule Variance, Overdue Items, Stale Tasks, Issue Activity, and Rework — without chasing updates across tools.
Compare projects side by side
Bring multiple sites into one workspace to spot performance gaps, track portfolio-wide progress, and report on everything from a single view.
Keep your context across every tab
Filter by area, discipline, system, equipment type, checklist status, and more once, then carry that same view across the entire platform.
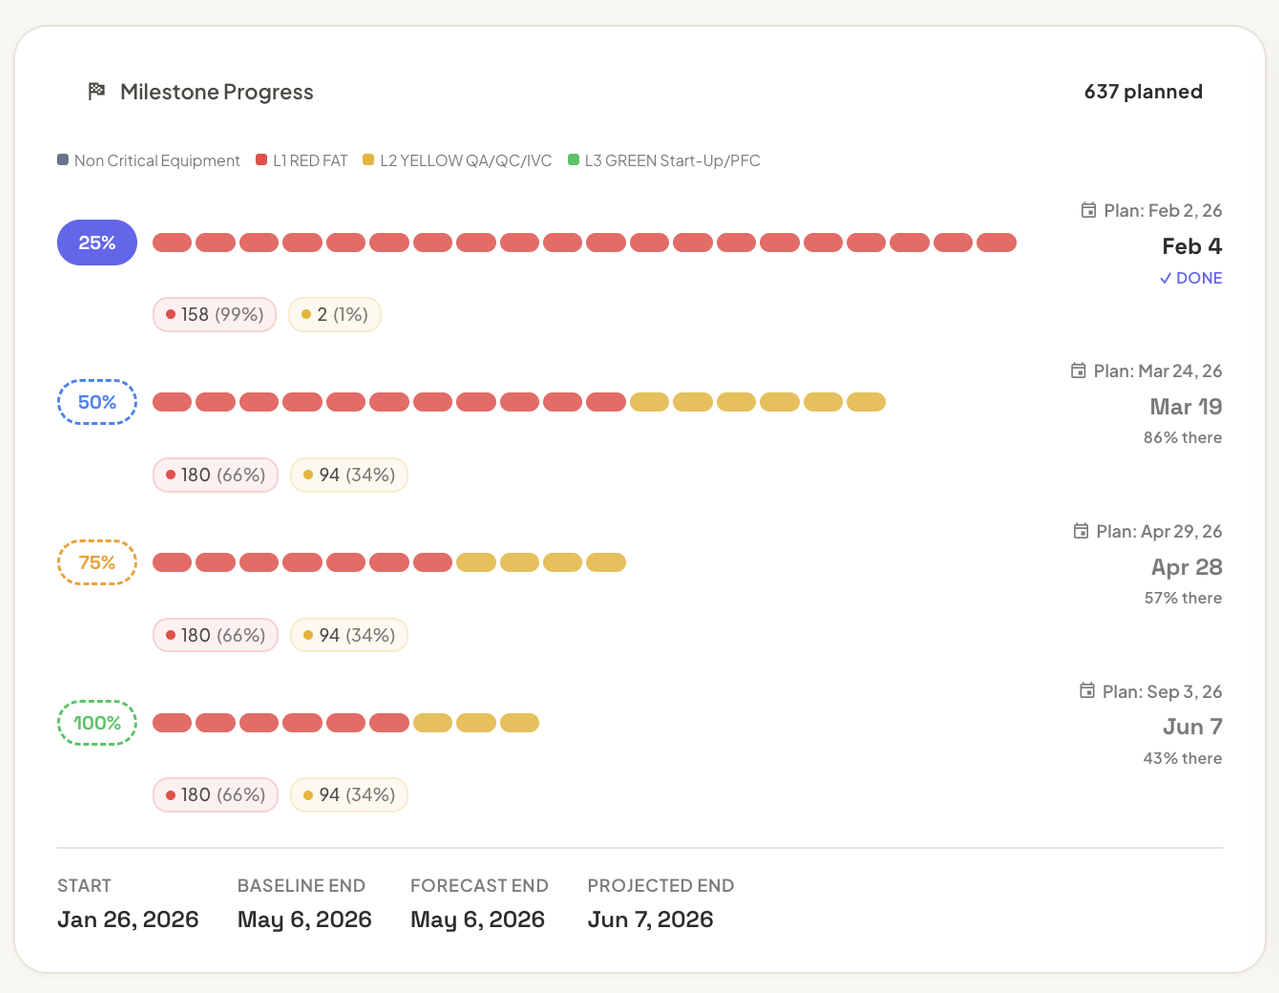
Schedule Tracking
Track planned, revised, and actual progress automatically from your commissioning platform.
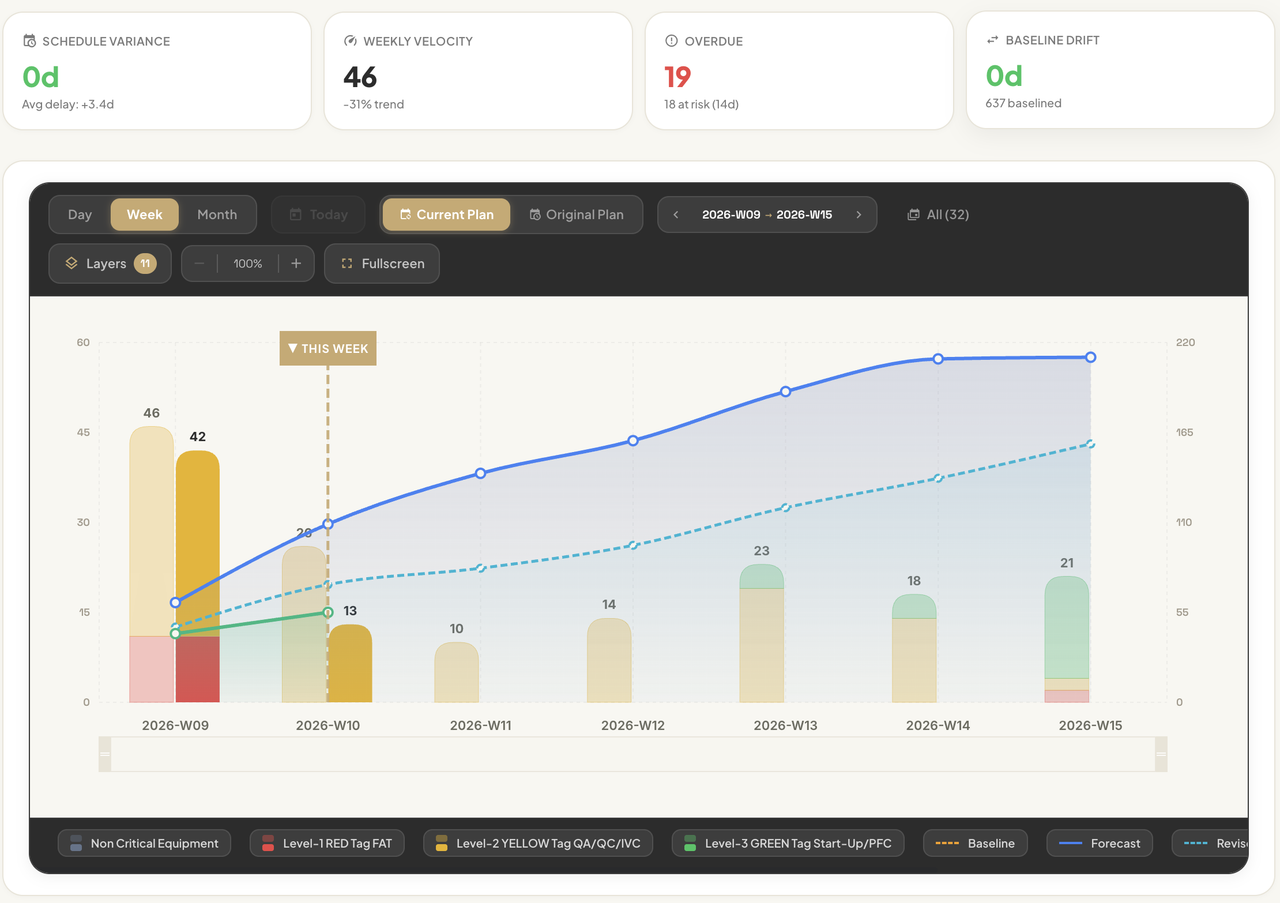
Planned vs Actual S-Curve
Compare your original planned dates, revised forecasts, and actual completions side by side. Stacked bars are color-coded by commissioning level.
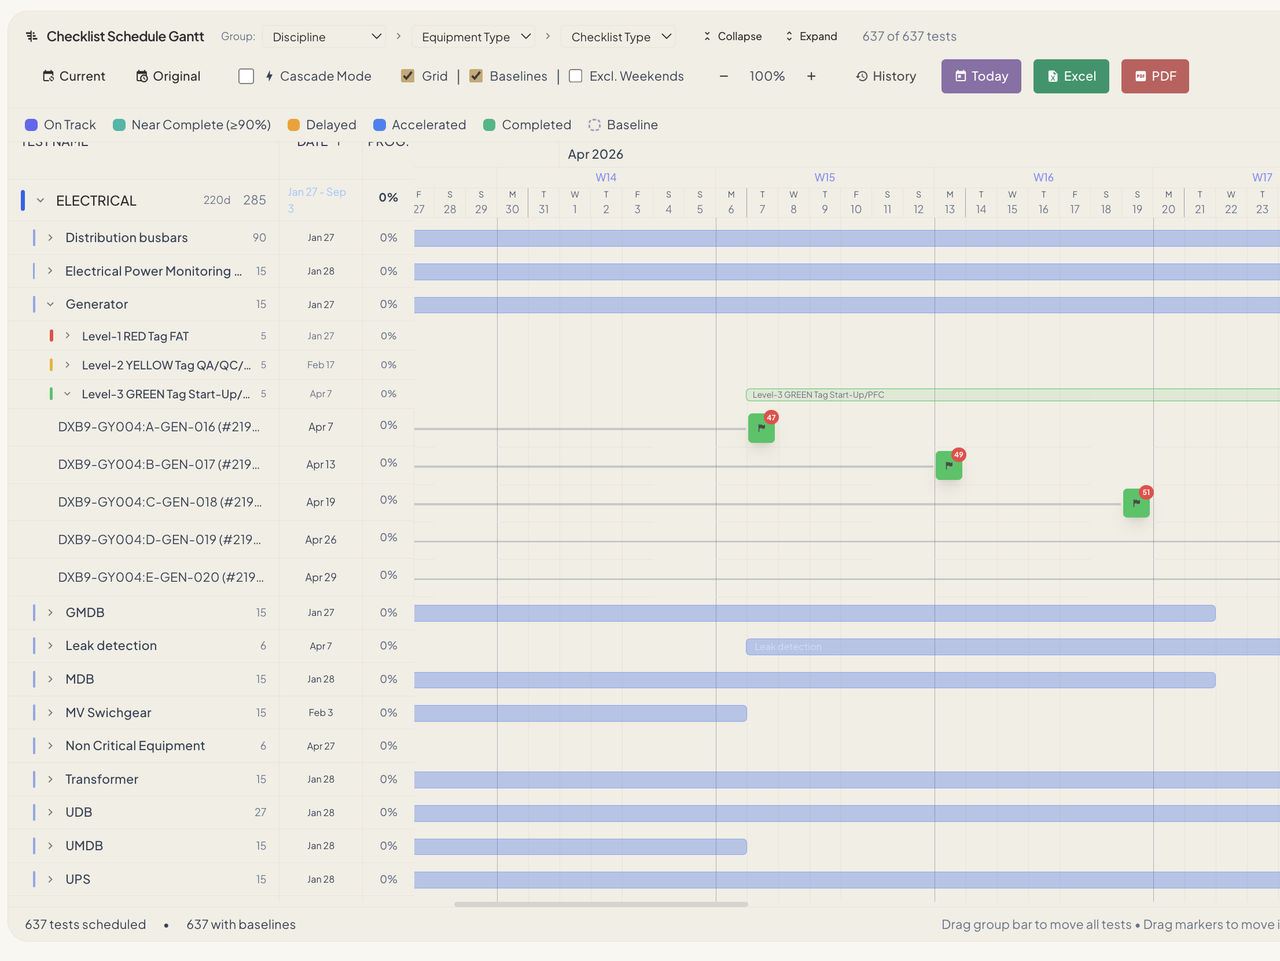
Smart Scheduler
Auto-generate schedules trained on your past projects. Reschedule all missed tags with one click and generate weekly lookahead plans instantly.
Baseline preservation
Every reschedule is tracked — who, when, and what moved. Original baseline dates are always preserved for comparison.
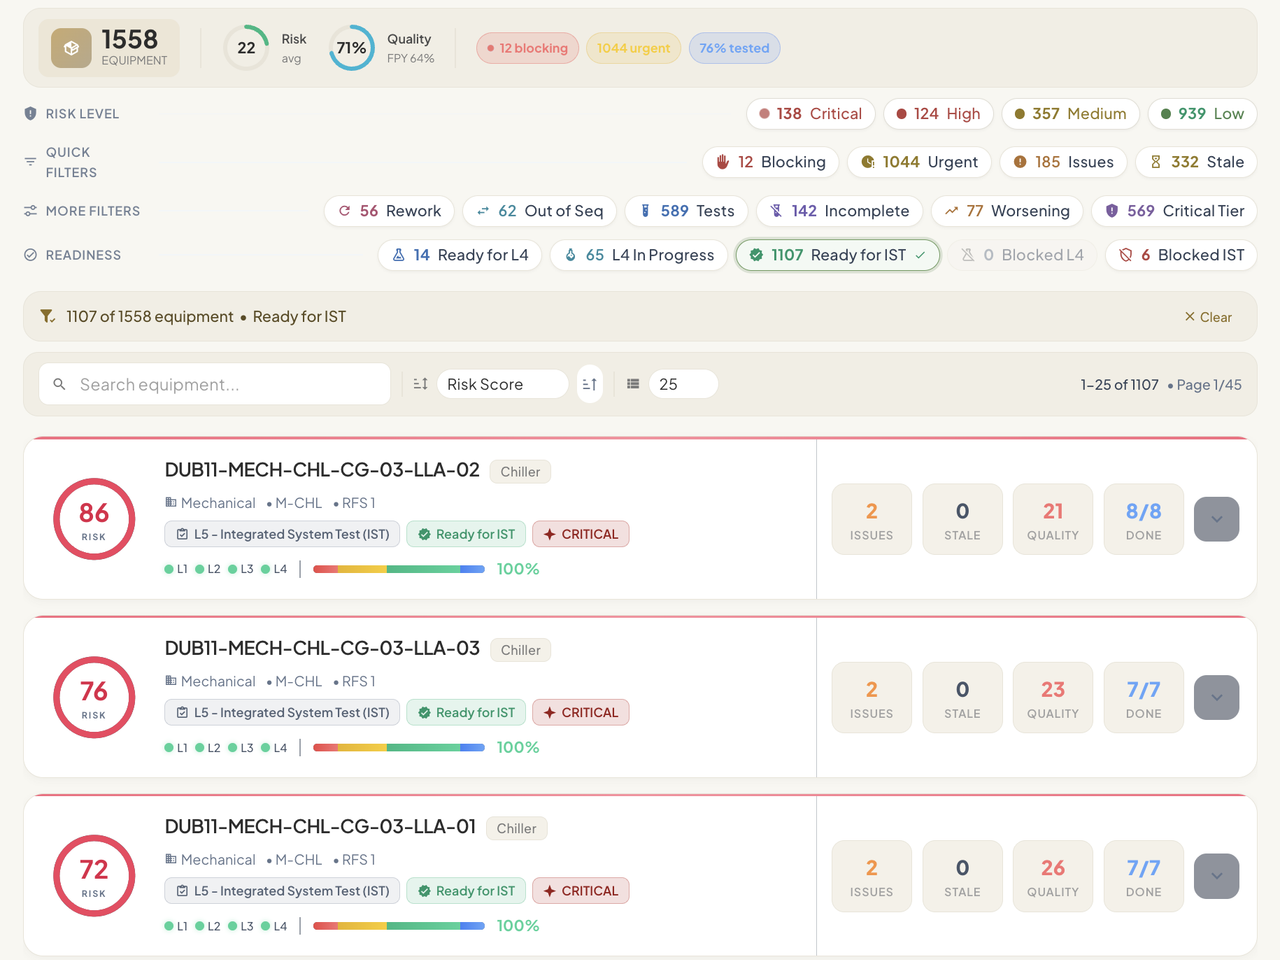
Risk Analytics
Surface high-risk equipment, readiness blockers, and closeout priorities before they delay handoff.
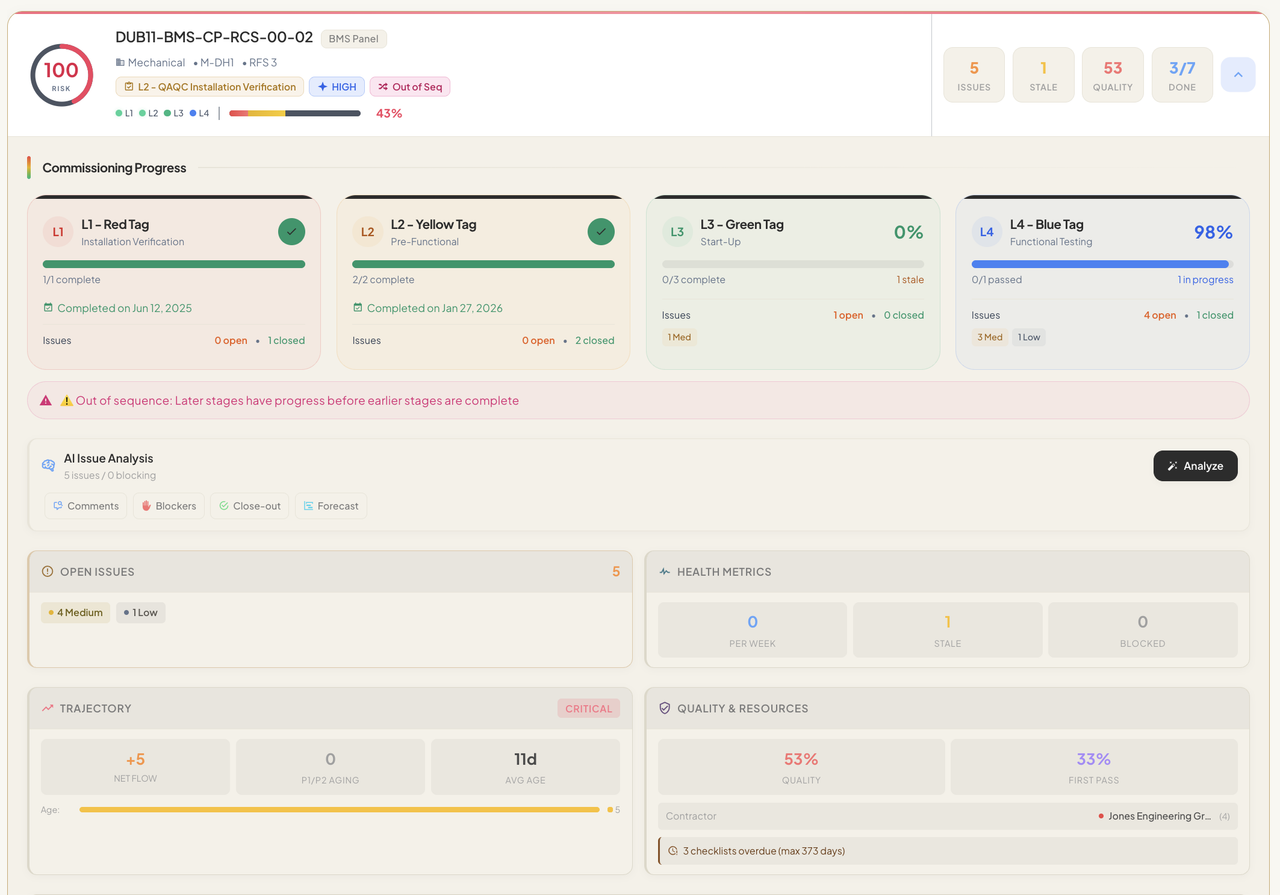
Equipment risk scoring
Dynamic 0–100 risk score per asset — instantly see which equipment needs attention and why.
Commissioning lifecycle tracking
Track each asset through Red → Yellow → Green → Blue Tag progression. Filter by readiness — Ready for L4, L4 In Progress, Ready for IST, Blocked L4, Blocked IST.
Root-cause risk insight
Understand what is driving risk with issue patterns, likely blockers, responsible parties, and closeout priorities surfaced directly from project data.
Report Generator
Turn live project data into polished PDF and Excel reports without rebuilding the same report every week.
Daily, period, and custom reports
Generate single-day status updates, date-range progress reports, or fully custom configurations. Export polished PDFs or Excel workbooks instantly.
Drag-and-drop section builder
Choose from 11+ section types — checklists, issues, equipment, tests, visual matrices, executive summaries — and arrange them with drag-and-drop. Filter and group each section independently.
Reusable templates & report config
Save any setup as a reusable template and share it across your team. Add your company and client logos, configure report metadata, and brand every export.
AI Agent
Query live commissioning data, investigate blockers, and get structured answers without digging through tabs manually.
Natural language queries
Ask "show open critical issues by system" or "which equipment has unresolved deficiencies?" and get structured, grouped results from your live project data instantly.
Answers grounded in live project data
Get structured responses based on current issues, equipment, checklists, and statuses instead of manually stitching answers together.
Commissioning-trained context
Understands commissioning levels, MEP disciplines, equipment types, and readiness workflows out of the box.
Integrations
CxStat connects directly to your commissioning platforms via secure API. Enter your credentials, pick a project, and your workspace populates in minutes — no CSV exports, no manual uploads.
Securely connect using HMAC credentials for CxAlloy or API tokens for FacilityGrid. All keys are encrypted at rest.
CxStat auto-discovers all projects on your account. Pick one and we pull checklists, issues, equipment, and people instantly.
Sync on demand or schedule automatic refreshes. CxStat always reflects the latest state of your commissioning project.
10+ views · Live KPIs · Reports
Getting Started
Add your CxAlloy HMAC credentials or FacilityGrid API token. CxStat validates and lists your projects instantly.
Pick any project. CxStat pulls checklists, issues, equipment, people, and statuses — enriched with S-curve calculations and risk scoring.
Navigate 10+ views, apply global filters, and export PDF/Excel reports on demand.
Central Hospital Cx
By the Numbers